 |
Главная |


GDP and Economic Well Being, Business Cycle
|
из
5.00
|
Gross Domestic Product is a market value of all services and goods, produced in a country during the given period of time, usually one year. It includes a total output (производство) of foreign firms in this country, but does not include an output of domestic firms in a foreign country.
GDP is the best single measurement of economic well-being of the country. Higher GDP, so then higher standard of life. GDP per person shows the average income and expenditure of an average person.
But GDP doesn’t show happiness, quality of life or situation in the country as environment, time parents spend with children, the activity of people in free time.
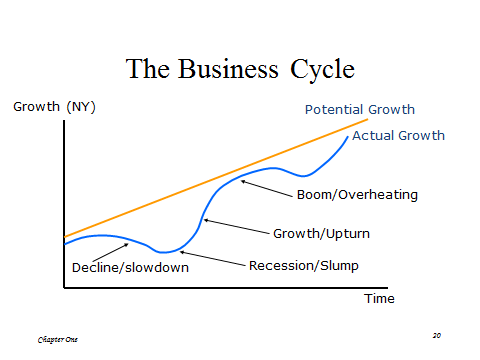
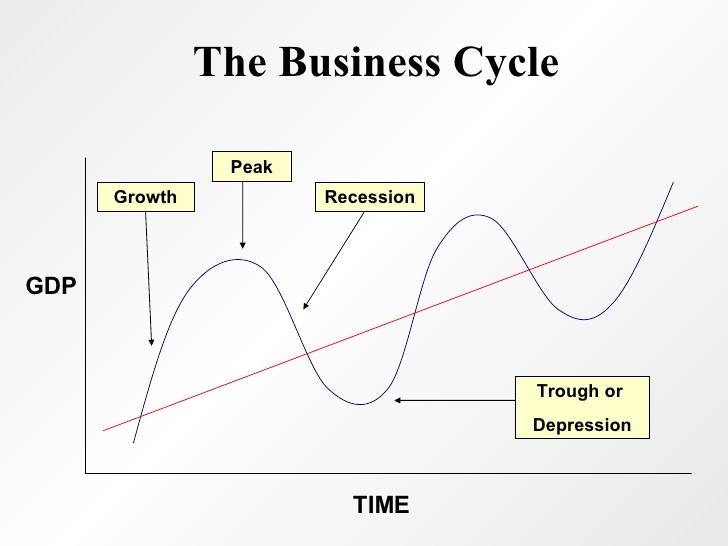
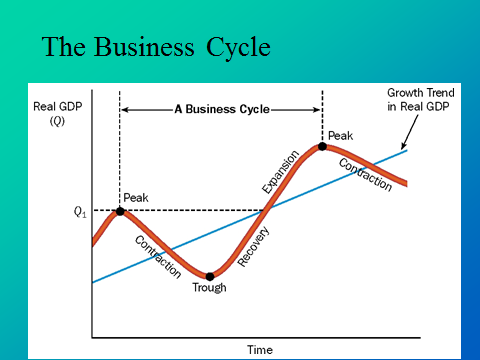
• Peak (Csúcs): at the peak of the business cycle, Real GDP is at a temporary high.
• Contraction(rövidülés): A decline in the real GDP. If it falls for two consecutive quarters (egymást követő negyedévben), it is said to be in a recession.
• Trough (Árok) The Low Point of the GDP, just before it begins to turn up.
• Recovery (Helyreállítás): When the GDP is rising from the trough.
• Expansion (Kiterjesztés): when the real GDP expands beyond the recovery
• Recession: It s a significant decline in activity spread across the economy, lasting more (tovább tartó) than a few months, visible in industrial production, employment, real income, and wholesale-retail trade”.
•
•
The components of GDP, GDP deflator
Nominal GDP measures the output in a current year price level. If there is a significant inflation in the country, so nominal GDP will be higher that real GDP
Real GDP measures the output in the base year level of prices.
GDP deflator (an indication of the overall level of inflation or deflation in the economy.) = Nominal GDP/Real GDP
The total demand for GDP (or income)=C+I+G+Nx, where
C-consumption by households
I-investments made by households
G-government purchase
Nx-net export or net foreign demand, which equals to
Ex-export
Im-import
GDP can rise, if
1) price level rises, output remains the same
2) price level remains the same, output rises
3) both price level and output rise
Circular Flow Model
Shows income received and payment made by each sector of economy. It is the simplest model that shows how macroeconomics works. The simple example shows hoe aggregate income is exchanged for resources, including the labor, that are bought from households.
Households: all population, own and provide factors of production
(labour, land, capital) to the firms, receive payments (income) from them and generate expenditures for goods and services
(for final consumption) .
They spend money purchasing output of firms.
Income:
+ Wages
+TRANSFERS From Government
Transfer payments are payments made by the government to people who do not supply goods, services, or labor in exchange for these payments.
Expenditures:
-Taxes
-Savings
Firms: “own” technology, employ factors, produce goods and services for final consumption (households, government, export) or for intermediate use (other firms, incl. foreign).
Pay households for use of factors of production
Sell goods and services to households
Incomes:
+Y =C+I+G
+TRANSFERS
Expenditures:
-Taxes To Government
-Wages to Households
-Savings
Government (state)
Collects taxes
Manages activities that society expects from it:
• spends on goods and services for public purpose (e.g. defence), on employees in state administration, even owns some firms (that produce goods and services) – “produces” public services
• finances transfers and social benefits
• Government taxation (T) reduces households’ disposable income and business funds
• Taxation (T)is a leakage (outflow)
• Government spending (G)includes expenditure on collective goods and services and goods and services provided by the business sector, plus transfer payments (social security payments)
Adding Goverment into the Circular Flow Diagram
What happens if we add government to the circular flow diagram
The government collects indirect taxes from consumption and direct taxes from income and uses for government purchases and transfer payments.
• Indirect taxes: Te (VAT, petrol duties, cigarette taxes)
• Direct taxes: Td (wages, interest, rents)
• Government expenditure: G
• Transfers: Tr
Investment and Savings
Investment (I), is the spending for acquiring newly produced physical capital.
Investment (I) = that part of production that is not used for current consumption, e.g. capital goods
Buying an old factory is not an investment for the economy.
Savings (S), household income minus the consumption
If the savings are not under the pillow then,
S = I
is always the case.
Saving (S) = Part of the Income that is not spent (leakage)
Closed Economy without Government Y=C+I
Households earn 7000 because they own factors of production
They spend 5000 and save 2000
So,
Y= C+S
The savings are used for investment So,
S = I is the case. Y = C+ I
Investment is an injection. If:
S > I, the economy contracts
S < I, the economy expands
S = I, the economy is in equilibrium
The financial sector acts as an intermediary between lenders and borrowers
Financial sector: provides transmission services that channel money from savers to borrowers
(incl. Government)
Foreign sector: purchases goods and services (exports), sells goods and services (imports),
generates flows of capital out and into the domestic country (FDI in or out, debt financing, equity capital)
Exports are goods that domestically sold abroad.
Imports are goods that are produced abroad but purchased for use in the domestic economy.
Another way of looking at the ways households, firms, the government, and the rest of the world relate to each other is to consider the markets in which they interact.
We divide the markets into three broad arenas:
the goods-and-services market,
the labor market, and
the money (financial) market.
The four aggregate macroeconomic sectors that form the foundation for macroeconomic analysis are the household sector, the business sector, the government sector, and the foreign sector.
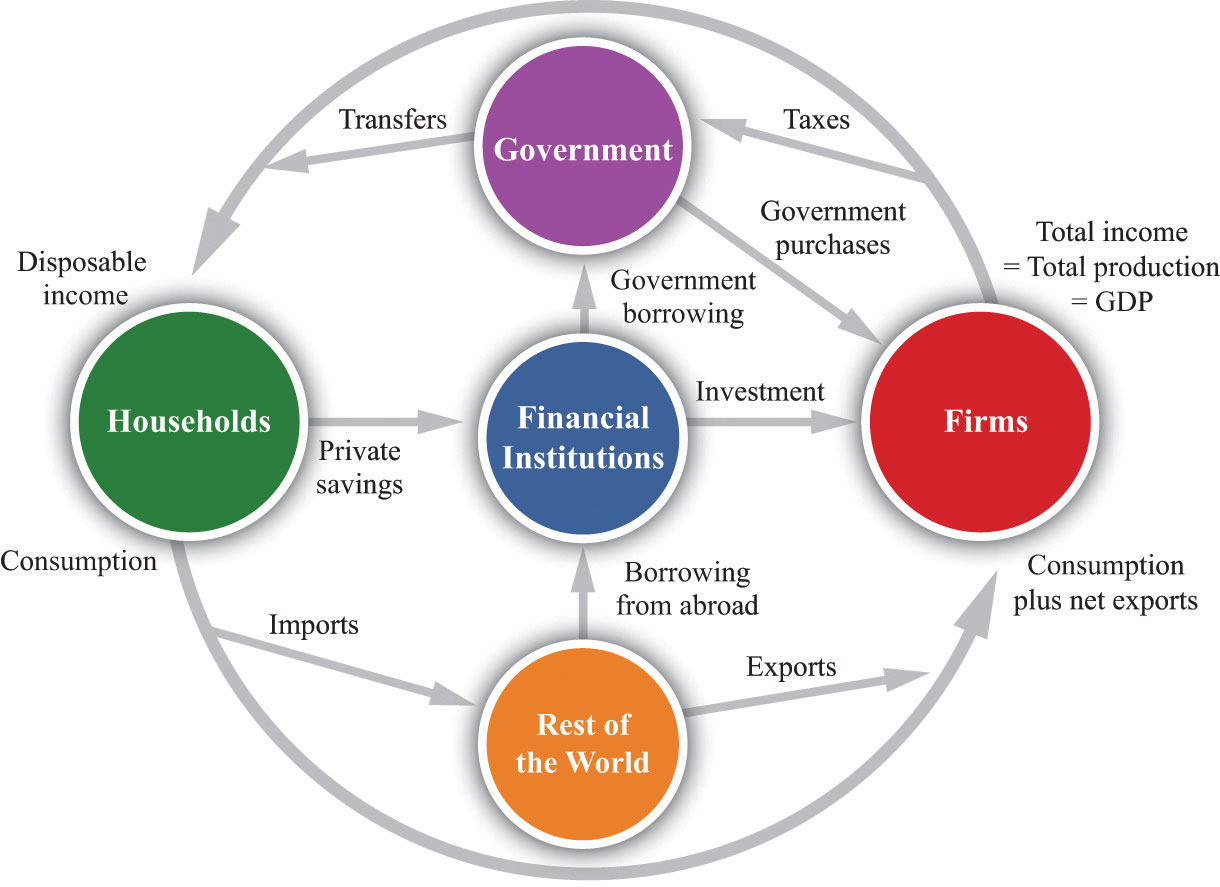
The complete circular flow has five sectors: a household sector, a firm sector, a government sector, a foreign sector, and a financial sector. Different chapters of the book emphasize different pieces of the circular flow, and Figure 16.10 shows us how everything fits together. In the following subsections, we look at the flows into and from each sector in turn. In each case, the balance of the flows into and from each sector underlies a useful economic relationship.
The Firm Sector
Figure 16.10 includes the component of the circular flow associated with the flows into and from the firm sector of an economy. We know that the total flow of dollars from the firm sector measures the total value of production in an economy. The total flow of dollars into the firm sector equals total expenditures on GDP. We therefore know that
production = consumption + investment + government purchases + net exports.
This equation is called the national income identity and is the most fundamental relationship in the national accounts.
By consumption we mean total consumption expenditures by households on final goods and services. Investment refers to the purchase of goods and services that, in one way or another, help to produce more output in the future. Government purchases include all purchases of goods and services by the government. Net exports, which equal exports minus imports, measure the expenditure flows associated with the rest of the world.
The Household Sector
The household sector summarizes the behavior of private individuals in their roles as consumers/savers and suppliers of labor. The balance of flows into and from this sector is the basis of the household budget constraint. Households receive income from firms, in the form of wages and in the form of dividends resulting from their ownership of firms. The income that households have available to them after all taxes have been paid to the government and all transfers received is called disposable income. Households spend some of their disposable income and save the rest. In other words,
disposable income = consumption + household savings.
This is the household budget constraint. In Figure 16.10, this equation corresponds to the fact that the flows into and from the household sector must balance.
The Government Sector
The government sector summarizes the actions of all levels of government in an economy. Governments tax their citizens, pay transfers to them, and purchase goods from the firm sector of the economy. Governments also borrow from or lend to the financial sector. The amount that the government collects in taxes need not equal the amount that it pays out for government purchases and transfers. If the government spends more than it gathers in taxes, then it must borrow from the financial markets to make up the shortfall.
The circular flow figure shows two flows into the government sector and two flows out. Since the flows into and from the government sector must balance, we know that
government purchases + transfers = tax revenues + government borrowing.
Government borrowing is sometimes referred to as the government budget deficit. This equation is the government budget constraint.
Some of the flows in the circular flow can go in either direction. When the government is running a deficit, there is a flow of dollars to the government sector from the financial markets. Alternatively, the government may run a surplus, meaning that its revenues from taxation are greater than its spending on purchases and transfers. In this case, the government is saving rather than borrowing, and there is a flow of dollars to the financial markets from the government sector.
The Foreign Sector
The circular flow includes a country’s dealings with the rest of the world. These flows include exports, imports, and borrowing from other countries. Exports are goods and services produced in one country and purchased by households, firms, and governments of another country. Imports are goods and services purchased by households, firms, and governments in one country but produced in another country. Net exports are exports minus imports. When net exports are positive, a country is running a trade surplus: exports exceed imports. When net exports are negative, a country is running a trade deficit: imports exceed exports. The third flow between countries is borrowing and lending. Governments, individuals, and firms in one country may borrow from or lend to another country.
Net exports and borrowing are linked. If a country runs a trade deficit, it borrows from other countries to finance that deficit. If we look at the flows into and from the foreign sector, we see that
borrowing from other countries + exports = imports.
Subtracting exports from both sides, we obtain
borrowing from other countries = imports − exports = trade deficit.
Whenever our economy runs a trade deficit, we are borrowing from other countries. If our economy runs a trade surplus, then we are lending to other countries.
This analysis has omitted one detail. When we lend to other countries, we acquire their assets, so each year we get income from those assets. When we borrow from other countries, they acquire our assets, so we pay them income on those assets. Those income flows are added to the trade surplus/deficit to give the current account of the economy. It is the current account that must be matched by borrowing from or lending to other countries. A positive current account means that net exports plus net income flows from the rest of the world are positive. In this case, our economy is lending to the rest of the world and acquiring more assets.
The Financial Sector
The financial sector of an economy summarizes the behavior of banks and other financial institutions. The balance of flows into and from the financial sector tell us that investment is financed by national savings and borrowing from abroad. The financial sector is at the heart of the circular flow. The figure shows four flows into and from the financial sector.
1. Households divide their after-tax income between consumption and savings. Thus any income that they receive today but wish to put aside for the future is sent to the financial markets. The household sector as a whole saves so, on net, there is a flow of dollars from the household sector into the financial markets.
2. The flow of money from the financial sector into the firm sector provides the funds that are available to firms for investment purposes.
3. The flow of dollars between the financial sector and the government sector reflects the borrowing (or lending) of governments. The flow can go in either direction. When government expenditures exceed government revenues, the government must borrow from the private sector, and there is a flow of dollars from the financial sector to the government. This is the case of a government deficit. When the government’s revenues are greater than its expenditures, by contrast, there is a government surplus and a flow of dollars into the financial sector.
4. The flow of dollars between the financial sector and the foreign sector can also go in either direction. An economy with positive net exports is lending to other countries: there is a flow of money from an economy. An economy with negative net exports (a trade deficit) is borrowing from other countries.
The national savings of the economy is the savings carried out by the private and government sectors taken together. When the government is running a deficit, some of the savings of households and firms must be used to fund that deficit, so there is less left over to finance investment. National savings is then equal to private savings minus the government deficit—that is, private savings minus government borrowing:
national savings = private savings − government borrowing.
If the government is running a surplus, then
national savings = private savings + government surplus.
National savings is therefore the amount that an economy as a whole saves. It is equal to what is left over after we subtract consumption and government spending from GDP. To see this, notice that
private savings − government borrowing = income − taxes + transfers − consumption − (government purchases + transfers − taxes)= income − consumption − government purchases.
This is the domestic money that is available for investment.
If we are borrowing from other countries, there is another source of funds for investment. The flows into and from the financial sector must balance, so
investment = national savings + borrowing from other countries.
Conversely, if we are lending to other countries, then our national savings is divided between investment and lending to other countries:
national savings = investment + lending to other countries.
|
из
5.00
|
Обсуждение в статье: GDP and Economic Well Being, Business Cycle |
|
Обсуждений еще не было, будьте первым... ↓↓↓ |

Почему 1285321 студент выбрали МегаОбучалку...
Система поиска информации
Мобильная версия сайта
Удобная навигация
Нет шокирующей рекламы